TIME-SERIES MODELLING / COIT29225
LSTM Mining Stock Forecasting
Does a recurrent neural network beat simply carrying forward the last observed stock price?
A retrospective comparison of recursive LSTM forecasts for RIO, BHP and FMG with two lookback windows and an explicit naive baseline.
- Python
- TensorFlow
- Keras
- LSTM
- Time Series
- Tuning runs
- 36
- Held-out trading days
- 50
- Stocks beating naive baseline
- 2 / 3
01 / VERIFIED PROJECT EVIDENCE
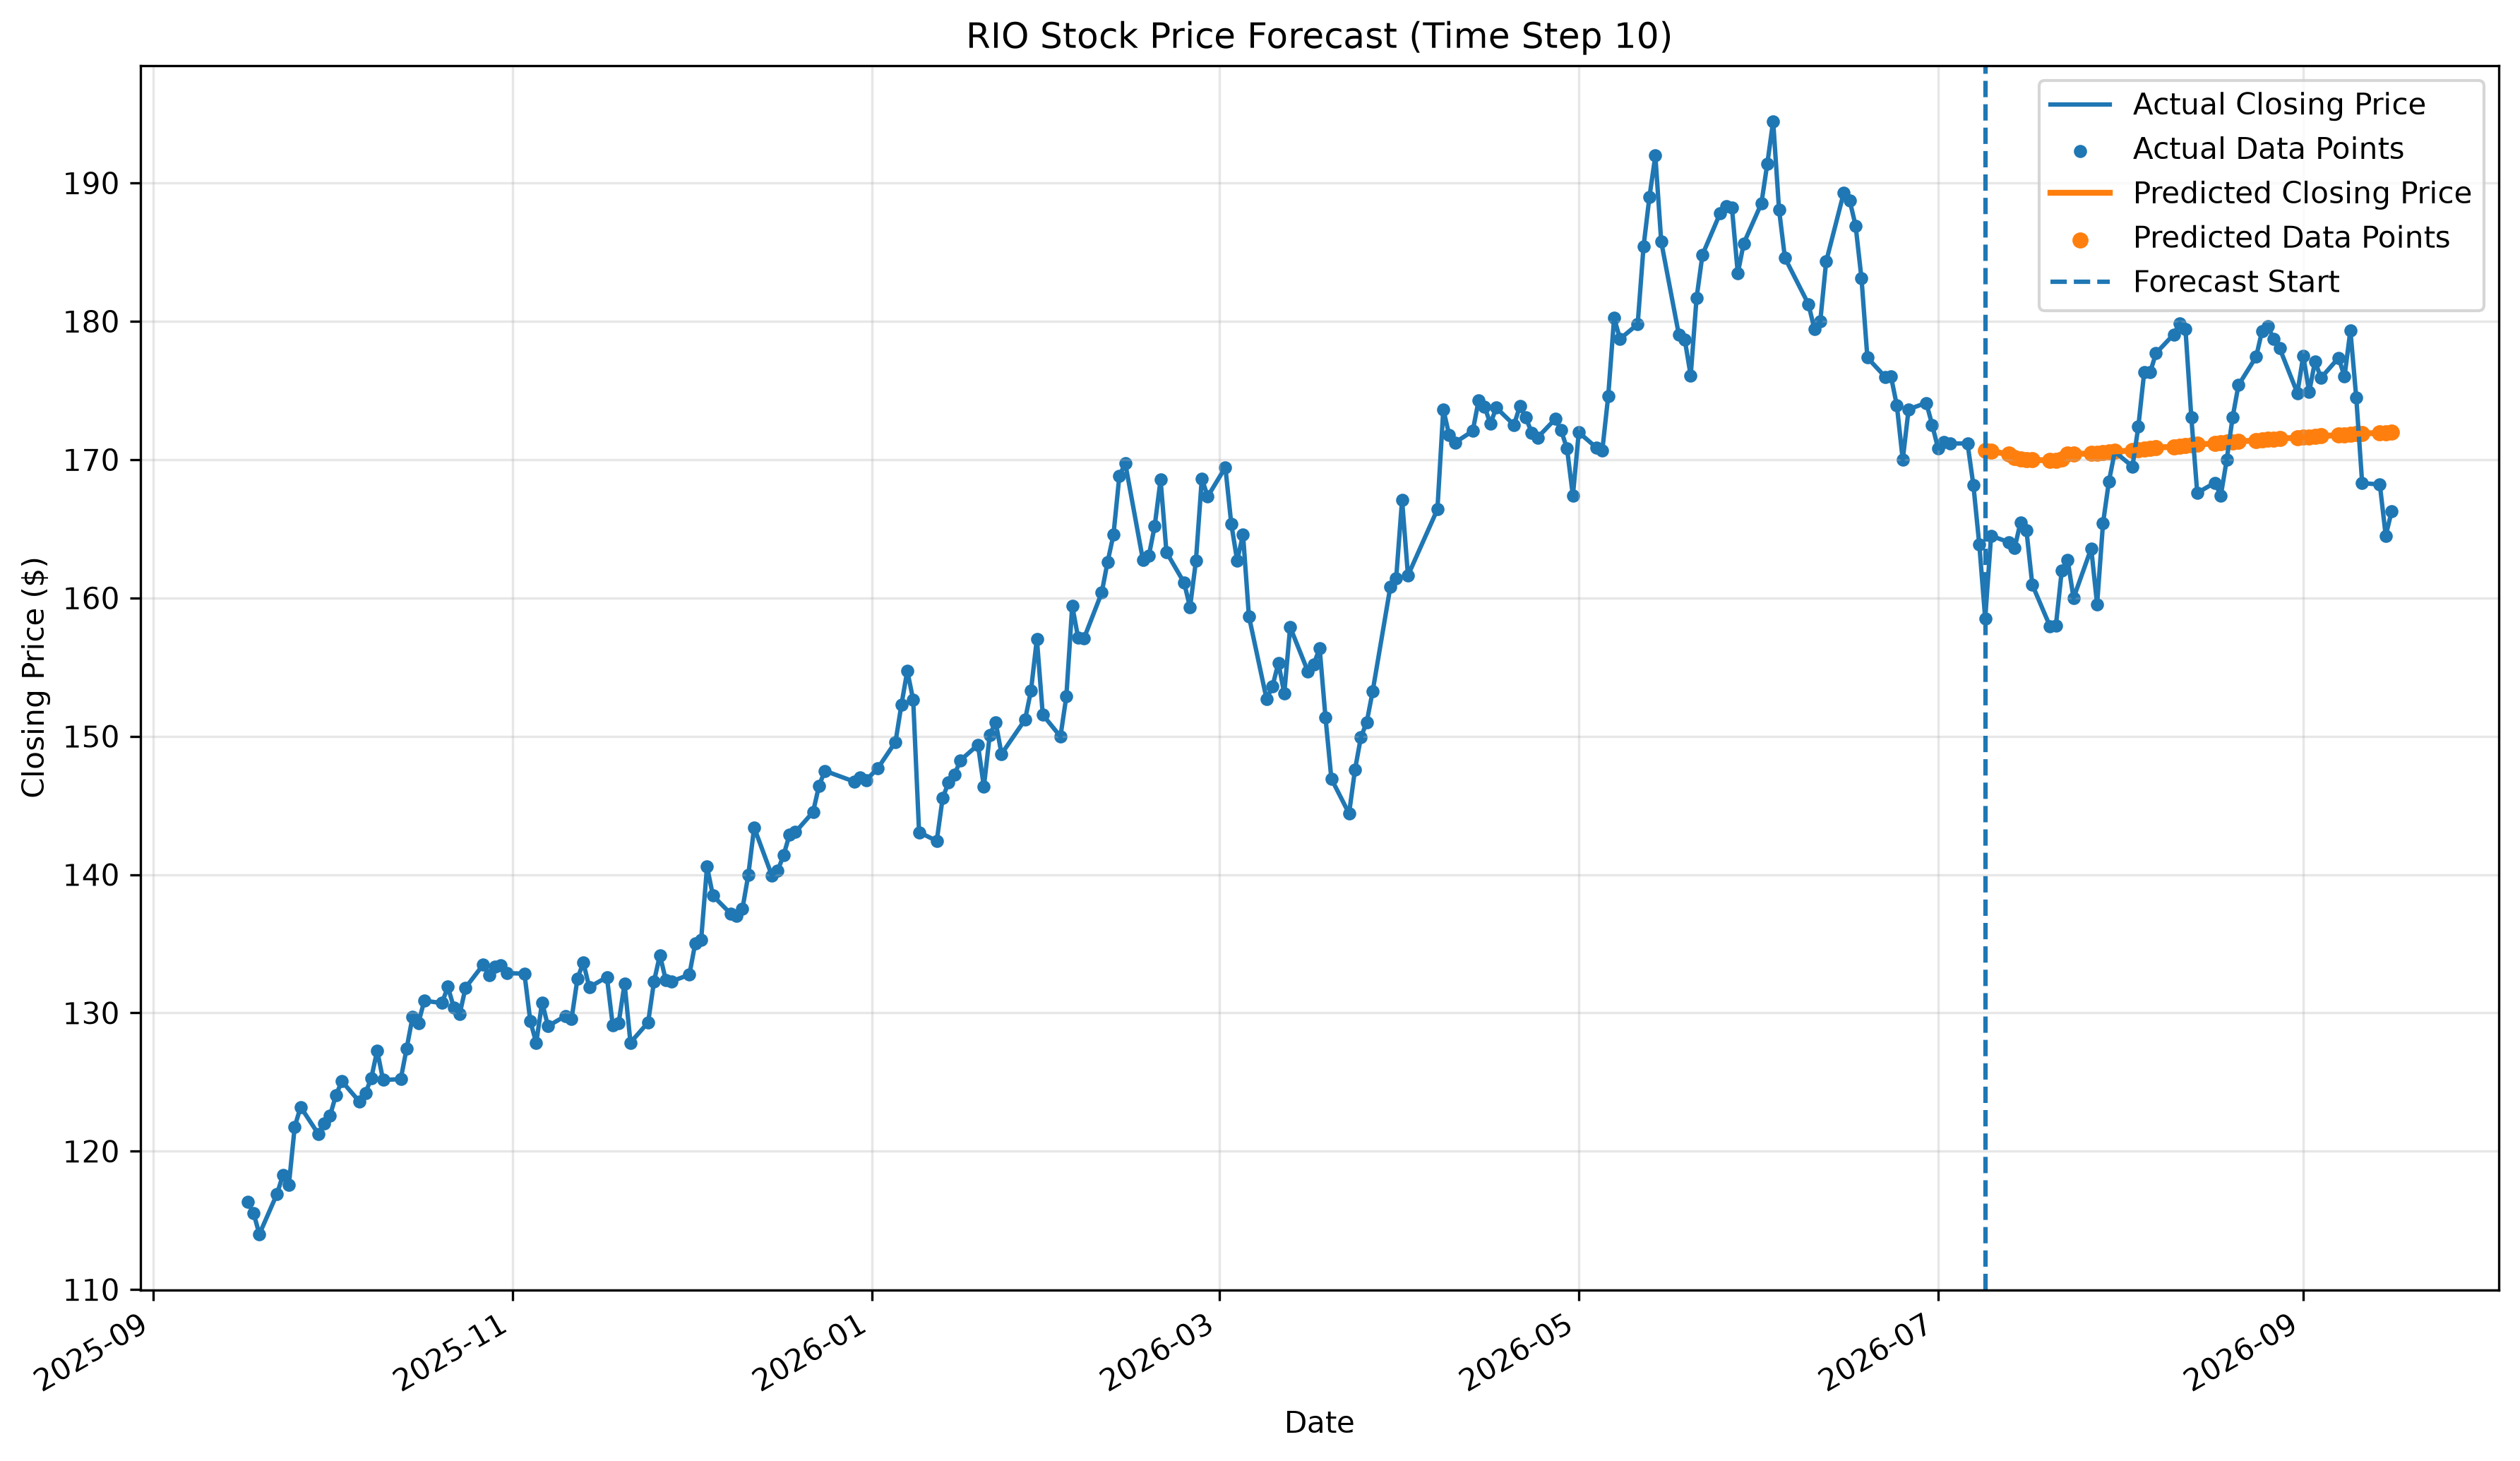
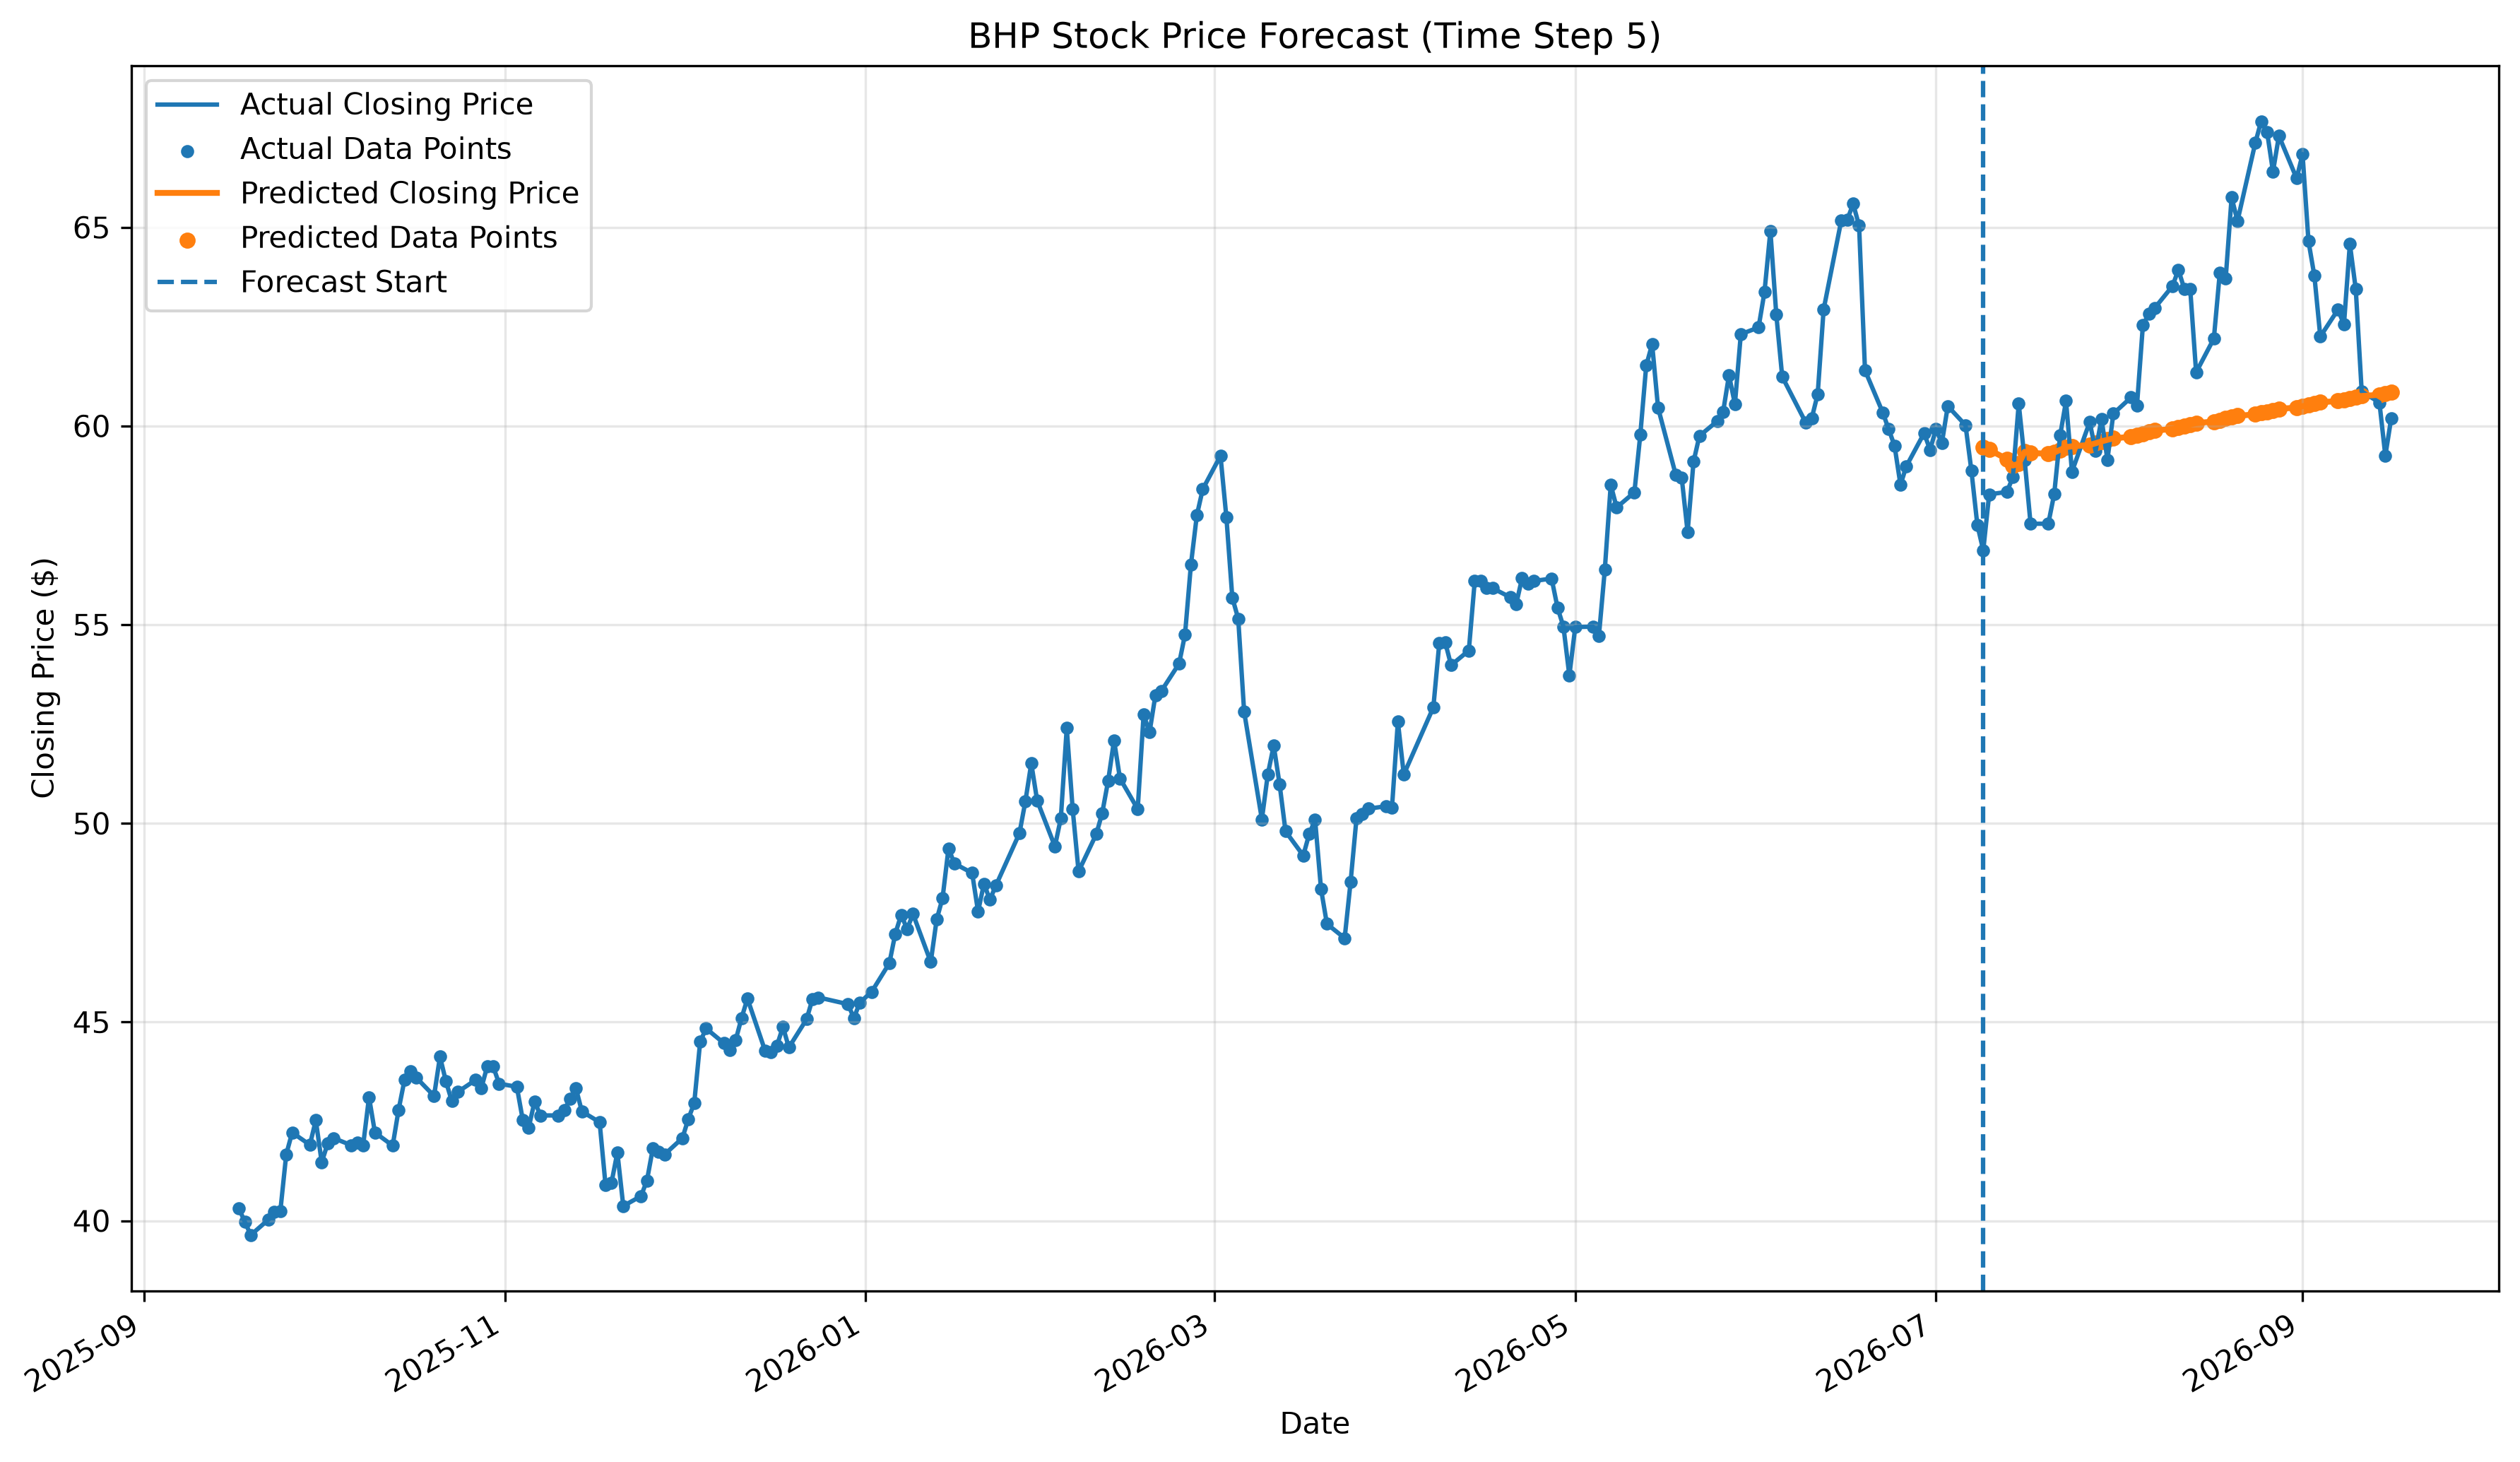
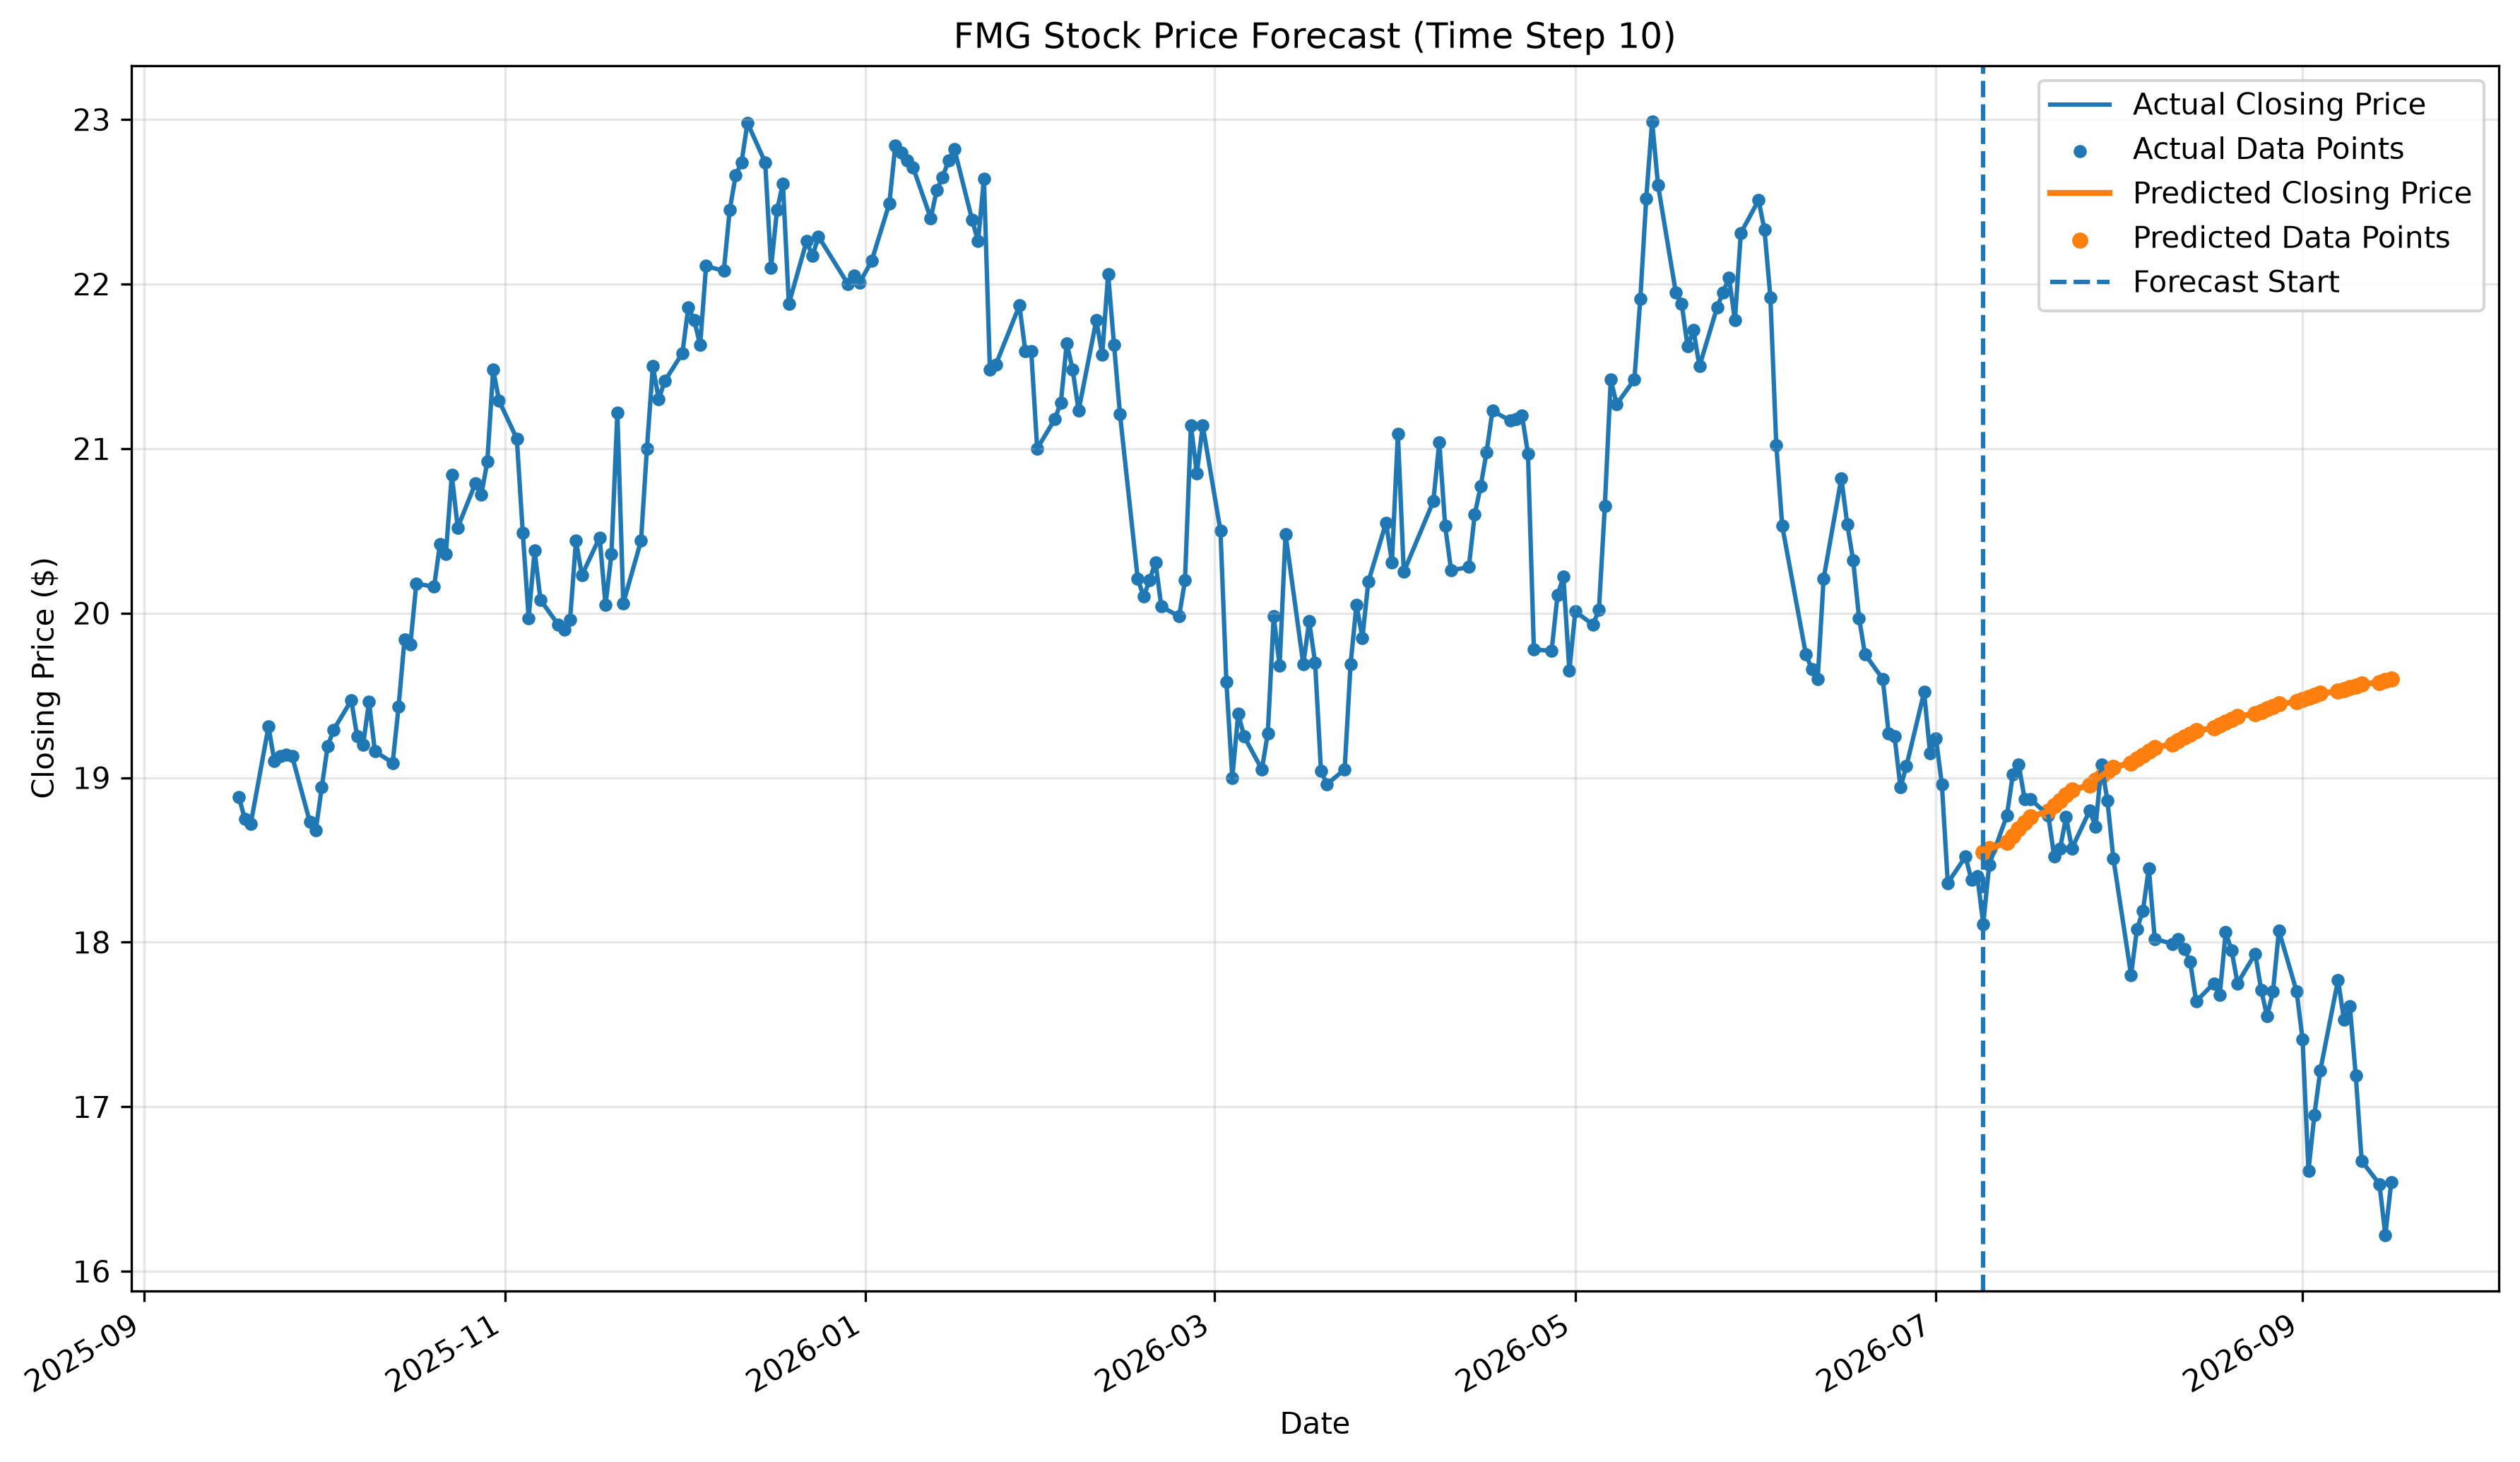
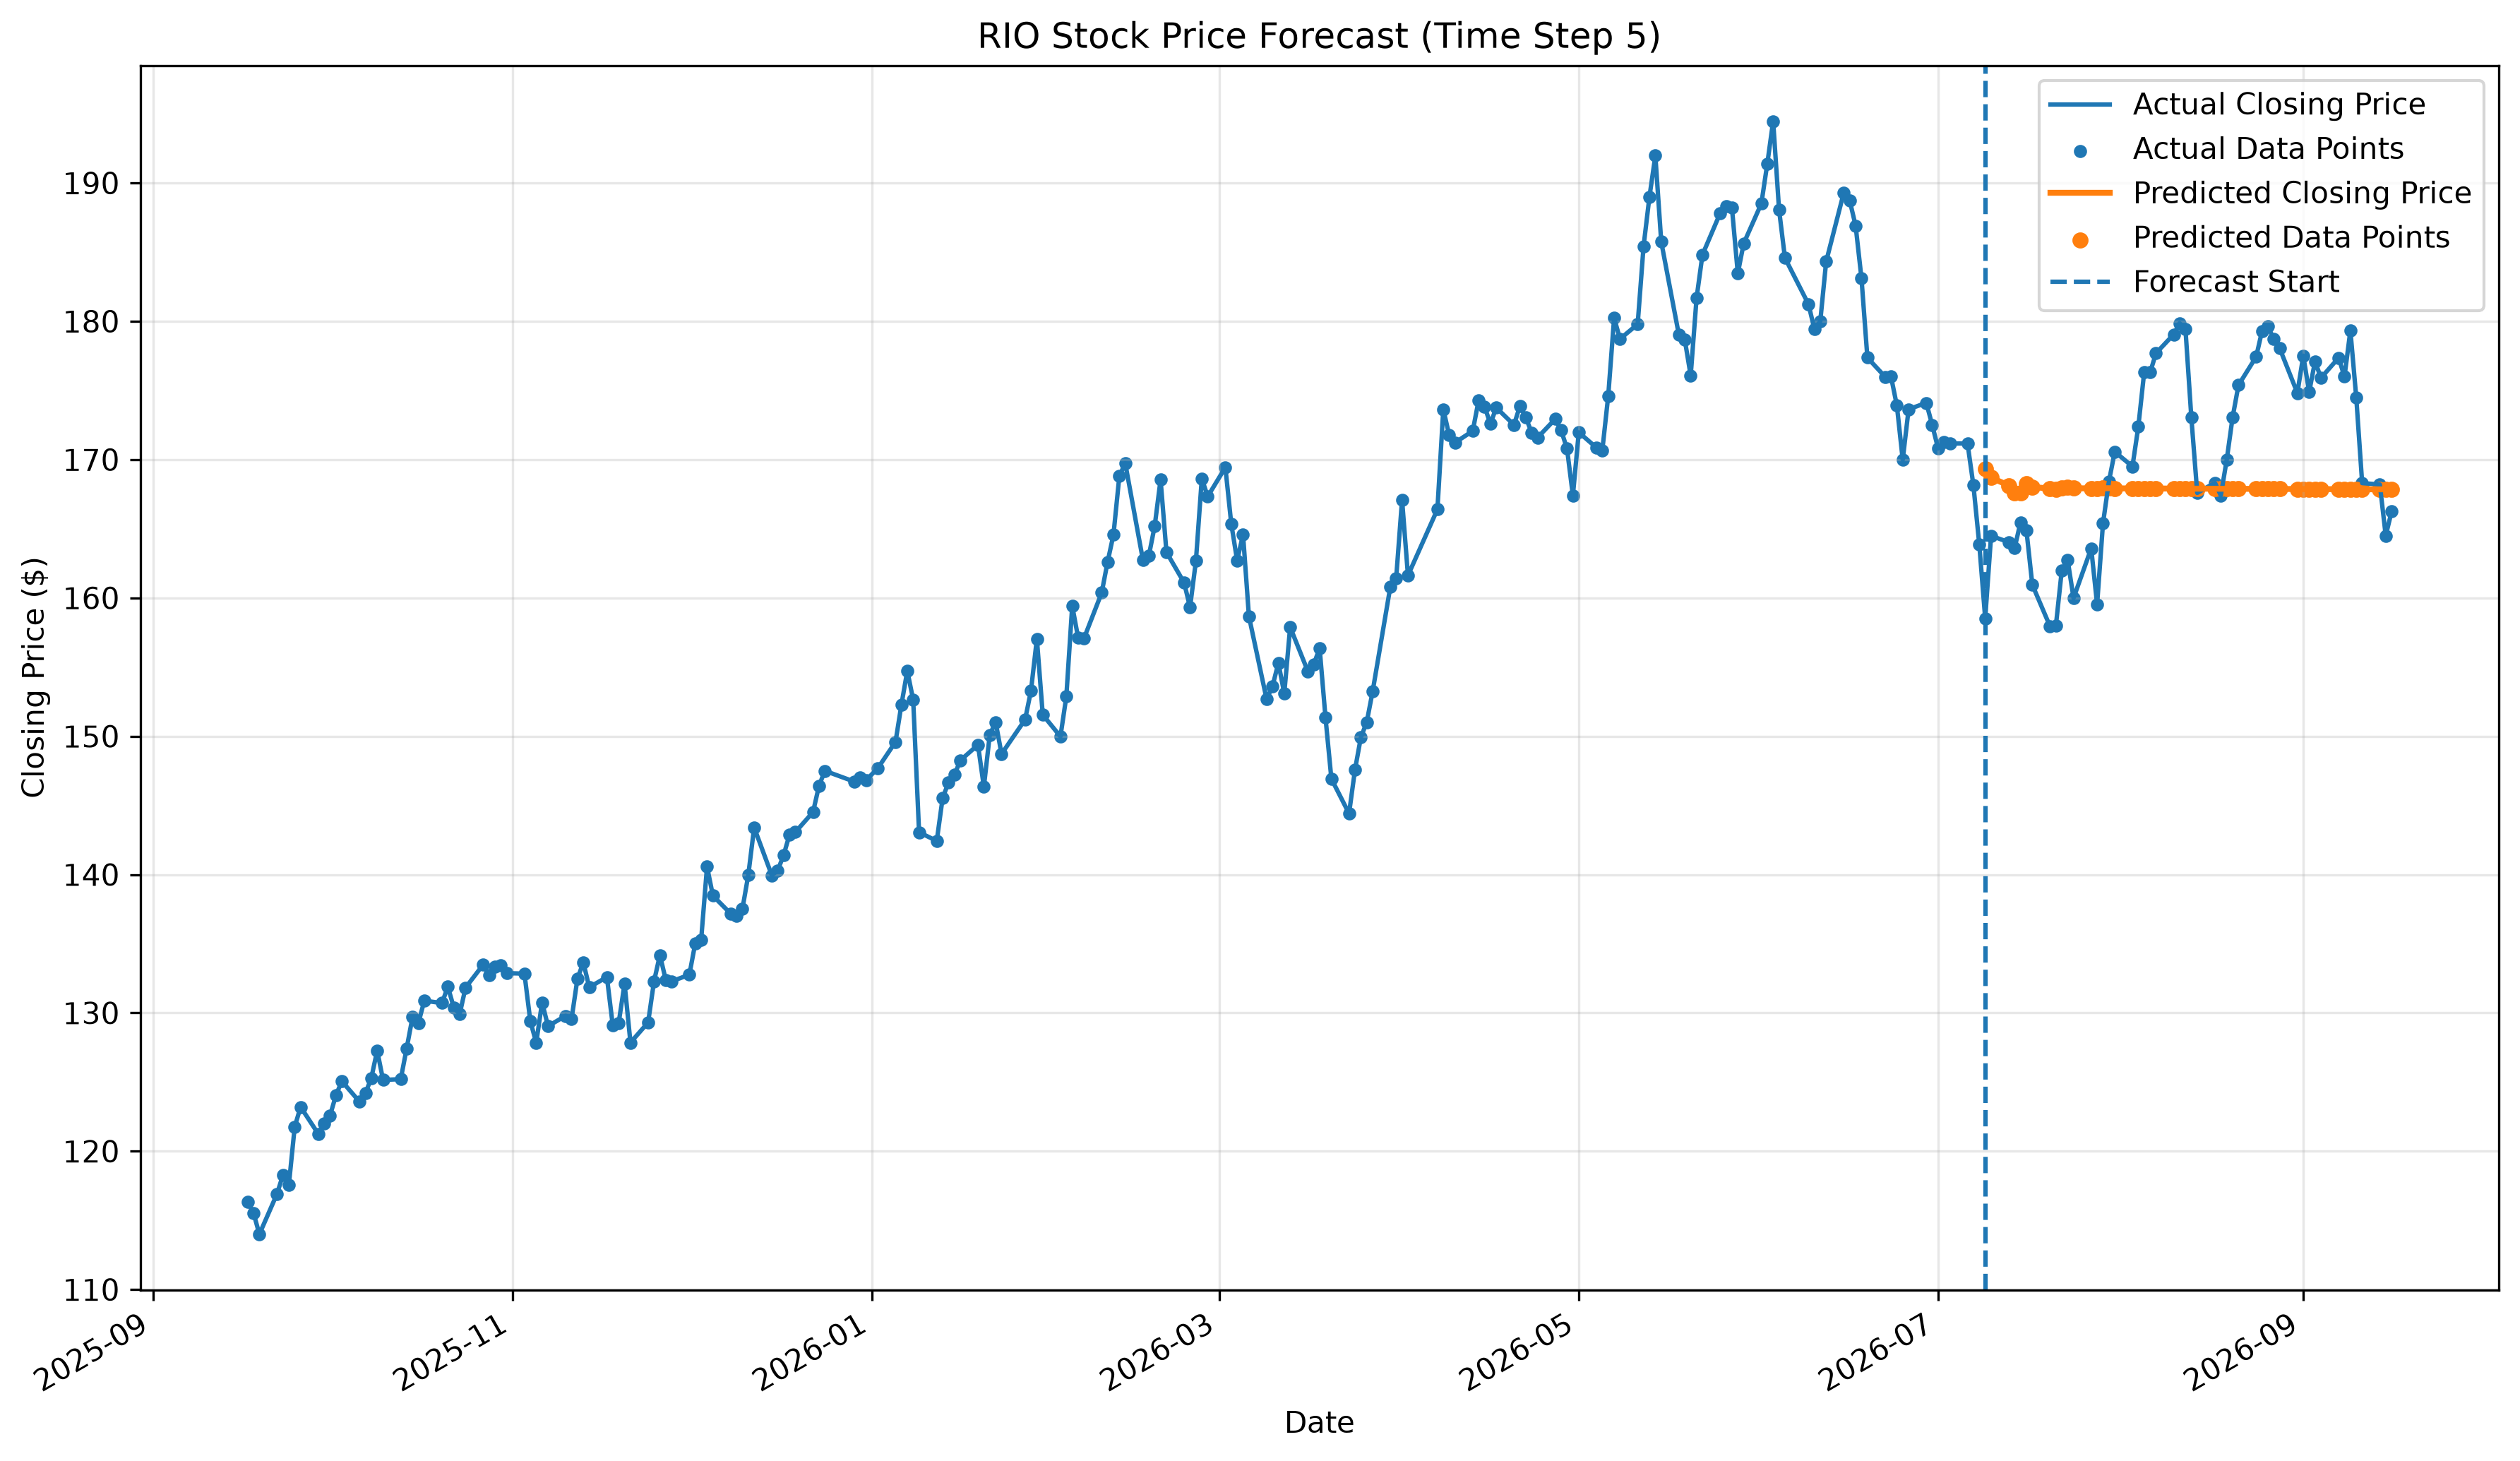
Original forecast visualisations.
These figures are the original recursive forecasts exported by the project scripts and now committed to the source repository. The separate 50-day RMSE table below provides the quantitative comparison with the naive baseline.
02 / PROBLEM
The engineering question.
Stock prices are noisy and models can appear strong if validation inadvertently uses future prices. A defensible forecast needs chronological splits and a simple baseline.
03 / METHOD
What I built and evaluated.
- Used 254 closing-price observations for each of RIO, BHP and FMG: 204 historical records and 50 held-out days.
- Tuned 5- and 10-day lookbacks with 16/32/64 LSTM units and 20/50 epoch configurations across all three stocks.
- Fitted scalers on historical training data and rolled forward 50 recursive predictions without feeding actual future prices to the forecast loop.
- Compared forecast RMSE against a last-observed-price baseline, retaining stock-specific results rather than publishing only the winning trials.
04 / MEASURED FINDINGS
What the evidence shows.
- RIO: best LSTM RMSE A$6.4662, compared with baseline A$9.4981.
- BHP: best LSTM RMSE A$3.3441, compared with baseline A$5.4177.
- FMG: best LSTM RMSE A$1.5686; the simpler baseline was better at A$0.8320. This negative result is an important part of the comparison.
05 / LIMITATIONS
Where the claims stop.
Historical assessment data and recursive forecasts are not an investment strategy. Tuning scores differ from the final 50-day evaluation. Source code, selected forecast graphs and final result CSVs are public; trained models and intermediate prediction artefacts remain excluded.
06 / BASELINE COMPARISON
Did the recurrent network beat a simple forecast?
| Stock | LSTM RMSE | Last-price baseline RMSE | Winner |
|---|---|---|---|
| RIO | 6.4662 | 9.4981 | LSTM |
| BHP | 3.3441 | 5.4177 | LSTM |
| FMG | 1.5686 | 0.8320 | Baseline |
Recorded experiments compare 5- and 10-day lookbacks and alternative LSTM configurations in 36 tuning runs. The final evaluation uses chronological data, training-only scaling and 50 recursive predictions without feeding actual future prices back into the model.
Engineering lesson: The negative FMG result is as important as the two improvements; complexity is not useful unless it outperforms a meaningful baseline.
Evidence boundary: Original forecast charts and the final results CSVs are now available publicly; trained models and source market datasets remain excluded. These observations are coursework results, not investment guidance.
PROJECT SOURCE
Inspect the implementation.
See the original code, data-handling choices, documented experiments and repository instructions.